- Crypto Saving Expert's Newsletter
- Posts
- Crypto Saving Expert Newsletter - Issue 115
Crypto Saving Expert Newsletter - Issue 115
Good morning! Bitcoin has had a rough start to "Uptober." To regain momentum and push toward all-time highs, bitcoin must first break through the downward trendline that has been capping its progress since March. Let's dive in for a closer look at what is going on behind the scenes with bitcoin and the overall Web3 market. 👇
This week's issue will feature technical analysis of bitcoin, Ethereum and SUI, as well as important dates and key news stories.
Table of Contents
Bitcoin Ignites The Bullish Dynamite
Bitcoin is edging closer to testing the vital high time frame resistance level which will decide if it enters price discovery or remains below.

Bitcoin Outlook

Bitcoin is at an interesting point on the lower time frame. It is close to retesting the S/R level, which it must hold to avoid a drop towards $60,000.
If bitcoin can build another rally from its current position, a charge back towards $66,000 is on the cards.
After over seven months of choppy price action, bitcoin will inevitably break in one direction for a phase of expansion, with a bull market awaiting if it is to the upside.
Breaking Through Resistance

Bitcoin has a tough road towards all-time highs. It must first break the downward trendline, which has capped momentum since March.
After conquering that, the price would also face the task of breaking through the horizontal $70,000-$71,000 region.
Still, bitcoin has created a higher low on the daily time frame and unless broken, this suggests the price would go on to form a higher high somewhere above $66,000.
Ethereum

Ethereum continues to be the weakest performer out of bitcoin, Solana and itself.
The price cannot sustain any upside push, and a drop below $2,000 could be on the cards if the lacklustre response to market bounces persists.
However, it may be forming a triple bottom pattern currently, which could spur a move towards $3,200 if the price can get above $2,800.
SUI

SUI was incredibly close to creating a new all-time high, with the price losing momentum just below the vital level.
Once broken, SUI looks set for the upside momentum to continue, and it could make a further 48% move towards $3.26, which is the 1.618 Fibonacci level.
In the event of an overall market uptick, SUI could reach $5.
Fear & Greed Index
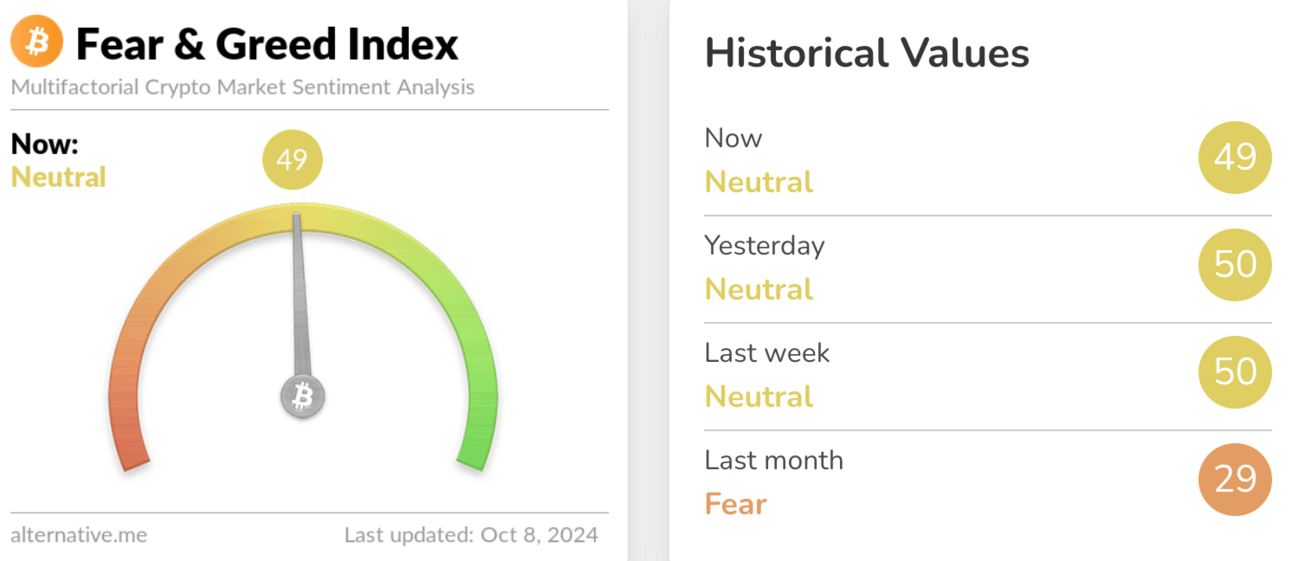
The Fear and Greed Index remains in Neutral zone and at 49 despite bitcoin’s return to $64,000 on Monday.
It appears that investors are yet to become excited about bitcoin’s upside move, potentially paving the way for higher prices before the Index enters Greed.
Important Dates
Wednesday 9 July, 18:00 UTC - FOMC Minutes
The minutes from the Fed’s FOMC meeting in June will be released. This will provide a deeper insight into what was discussed in the meeting alongside the tone of the comments.
The market will use the minutes as a marker leading up to the next FOMC meeting.
Thursday 10 October, 12:30 UTC - US Consumer Price Index (CPI)
CPI measures inflation and is a vital economic measurement in all countries. The data is released by the Bureau of Labor Statistics and calculated using a shopping basket of goods and services.
The data is forecast at 2.3%, with the previous data at 2.5%.
Friday 11 October, 12:30 UTC - Producer Price Index (PPI)
The Bureau of Labour Statistics is also responsible for PPI, which measures the average change in commodity producers. Similar to core inflation, PPI removes volatile goods from its findings. The forecast is set at 2.7%, with the previous data at 2.4%.
Friday 11 October, 14:00 UTC - Michigan Consumer Sentiment Index
The University of Michigan releases the index, which is a survey depicting consumer confidence in the economy. The survey provides insight into consumers’ confidence to spend money within the US economy.
The Index’s score is set to come in at 71, with the previous data coming in at 70.1.
Gainers

/im
Losers

Bitcoin Price Prediction: Analyst Sees a 40% Chance of $100k By End of Year
Historical data shows that Bitcoin had mostly positive fourth-quarter gains, which could fuel a push to $100k.

After a tumultuous start in October, Bitcoin is again in the green.
Data from Coinglass shows that Bitcoin's returns in October are now at 0.57%, reigniting optimism of “Uptober” after an impressive September that defied all expectations of a red month based on historical data.

Source: Coinglass
Bitcoin has a 40% Chance of Hitting $100k by End of 2024
BTC’s tendency to follow historical trends is why Bitcoin and crypto analystTimothy Petersonbelieves the number one crypto could hit $100,000 by the end of this year.
“Bitcoin 4th quarter performance is typically positive by a significant magnitude. The exceptions tend to be bear market years like 2022 and 2018. 2024 is not one of those,”he wrote on X.
He added, “So I would expect a gain of about 30-60% this quarter. I'd say there's a 40% chance of $100k by the end of the year.”
Is “Uptober” Back?
Inan earlier postlast week, when Bitcoin looked weak and headed below $60,000, Mr Peterson requested investors and traders to be patient, explaining that the highly anticipated “Uptober” does not start until after the 19th of October.
As to what might trigger a return of “Uptober”, the team at QCP wrote in theirrecent market updatethat Bitcoin’s $60k support continues to hold due to “the Uptober narrative coupled with strong NFP (non-farm payrolls) numbers.”
They added that crypto was again in the spotlight due to HBO’s upcoming documentary, which promises to reveal the identity of Bitcoin creator Satoshi Nakamoto.
Bitcoin Needs to Flip the 200-day MA Into Support
From a technical analysis point of view, the one-day BTC/USDT chart below shows that Bitcoin is now back above the crucial 200-day (green) moving average as it attempts to flip it into support around the $64,000 price level.

Source: Tradingview
In addition, Bitcoin’s one-day MFI (green), MACD, RSI (red), and Stonksy indicator suggest that bulls are slowly taking charge and could successfully push BTC above the $65,000 resistance level in the following days.
Such a move will likely fuel another drive to $68,000, but only if Thursday’s US consumer price index shows a drop in inflation, signalling a potential 25bps rate cut by the Federal Reserve.
But if US inflation is hot, a dip towards $60,000 is back in play.
Tesla Investor Sues Investment Firm for Mismanagement After Turning $88k Into $415m and Losing It All
Christopher DeVocht sues RBC Dominion Securities and Grant Thornton LLP after turning $88,000 into $415m and losing it all, alleging financial mismanagement and poor advisory services.

A Canadian-based investor who reportedly turned an $88,000 investment into $415m is suing his investment firm, RBC Dominion Securities, and his financial advisers for alleged mismanagement that led to the loss of his entire fortune.
Christopher DeVocht claims that the financial firm failed to provide him with sound guidance during high-risk trades, ultimately resulting in the collapse of his portfolio.
RBC Dominion Securities and Grant Thornton LLP Under Fire According to a report published on 3 October by Stockwatch, DeVocht alleges that RBC Dominion Securities set him up with a margin account and substantial loans that were later instrumental in his financial downfall.
DeVocht primarily built his wealth through aggressive trading of Tesla shares and options, which skyrocketed his portfolio value.
Seeking expert advice, DeVocht hired RBC Dominion Securities to help manage his growing wealth. He was assigned a financial team, including a tax adviser from Grant Thornton LLP and an RBC employee who acted as a “financial coach” to guide him on long-term wealth preservation.
Using Tesla and Options to Make Millions Options trading is a financial strategy which involves buying and selling options contracts. An options contract gives the contract holder the right, but not the obligation, to buy or sell an underlying asset, such as Tesla stock, at a specified price, also known as the "strike price", before the contract's expiration date.
Options are derivatives, meaning their value is based on the price of another asset and can be used to generate profit quickly, as was the case with DeVocht.
Tesla and Stock Market Downturn Triggers Massive Losses
DeVocht successfully traded his portfolio to a staggering $415m by 30 November 2021.
However, his fortunes took a sharp downturn in 2022 as Tesla stock and the broader financial markets suffered significant declines. As Tesla’s stock prices dropped, DeVocht was forced to sell shares to cover the debt obligations from his margin account.
This further exacerbated his losses, resulting in a near-total wipeout of his portfolio.
DeVocht Seeks Damages for Alleged Advisory Failures
DeVocht’s lawsuit states that his losses could have been avoided had RBC and Grant Thornton LLP offered better financial advice, particularly regarding risk management. He stated:
"But for the defendants’ inadequate advice... the plaintiffs would have preserved a substantial portion of their wealth and implemented financial planning that would not have resulted in the loss of their entire net worth.”
DeVocht is now seeking court-ordered damages, legal costs, and interest, naming RBC Wealth Management Financial Services and Grant Thornton LLP as defendants in the lawsuit.
The case was filed in the Supreme Court of British Columbia, but the defendants have yet to respond.
Is Bitcoin Forming a Triple Bottom? Key Levels, Market Structure, and What to Expect
Bitcoin appears to be forming a triple-bottom pattern. With the switch in high time frame structure and apparent strong support at the $60,000 level, could the bullish headwinds of Q4 spark bitcoin’s Uptober?

Is Bitcoin Forming a Triple Bottom? Key Levels and Market Structure Breakdown
Recent chart formation developments show thatbitcoinis in the process of forming a triple-bottom pattern.
A triple bottom is a bullish reversal chart pattern that signals a potential shift from a downtrend to an uptrend. It is formed after a prolonged decline in an asset's price and consists of three distinct lows at roughly the same price level, followed by a breakout above a key resistance level.

Chart pattern showing bitcoin potentially making a triple bottom. Source: TradingView
If this pattern forms, bitcoin could be on the verge of a significant breakout. In this article, we'll explore bitcoin's current market structure, key psychological levels, and why Q4 tends to be a bullish period for the crypto markets.
Breaking Bitcoin’s High-Time-Frame Market Structure at $66k
At the end of September, Bitcoin hit a critical juncture. It broke its long-term trend, forming a new high-time-frame (HFT) market structure as it broke through to its recent high at $66,000.
This event was significant for bitcoin and the wider crypto market, as the breakout signalled a potential end to the bearish trend that started after bitcoin broke its all-time high in March of this year. Since then, the asset has struggled with momentum, making a series of lower highs and lower lows as the price dropped from its peak of $73,737 to its 5 August low below $50,000.

Chart pattern showing a long-term downward trend which appears to have broken with the ascension to $66,000 in late September. Source: TradingView
Although the price has since pulled back to $61,000, the $66,000 level represents a crucial resistance zone for future upward momentum and also shows the formation of a higher high, breaking this previous downtrend. A potential retest of the level would confirm this fact, confirming bitcoin's bullish trajectory.
Is Bitcoin Forming a Higher Low?
In fact, bitcoin's recent pullback to its current level may be positioning the asset to form a critical psychological level on the chart.
If the $60,000 level can hold, it would have crucial psychological significance in the market. Successfully defending this level could indicate that bitcoin is building a solid support base. If this low holds, it may pave the way for a new push toward higher highs and a potential breakout from its consolidation phase.
$60,000: The Critical Psychological and Technical Support
The $60,000 mark is not only a psychological barrier but also a crucial technical level.
Currently, bitcoin is holding support at its 50-day moving average (50DMA), which also happens to be the $60,000 level. This moving average is a commonly tracked indicator used to assess mid-term trends. The fact that bitcoin has maintained this support reinforces the possibility of a bounce.
A successful defence of this level could confirm the formation of the triple bottom pattern, setting the stage for a significant rally.
Q4: Historically a Bullish Period for Bitcoin
Another bullish factor is bitcoin’s average performance in the year's fourth quarter.
Driven by an institutional and retail interest in the asset as well as favourable macroeconomic conditions, bitcoin has often made substantial upward moves during this period.
Looking at data from Coinglass reveals that bitcoin's current monthly performance shows a dip of 4.9%. Compare this to the average monthly gains for October, which usually sees bitcoin gain 20.58%, and you can see that this start to the month has been unusually poor. In fact, if bitcoin successfully posts an average month for October, we could see bitcoin break through $76,000.
If we look beyond this, Q4 typically sees bitcoin return a gain of 81%, data which is heavily influenced by the bullish events of 2013, 2017 and 2020. Looking at the median data also gives strong returns of over 31%. Using these data sets we can extarpolate bitcoin’s current poor performance to estimate that these two historical factors could send bitcoin to $133,000 and $83,000 respectively.
Conclusion: Bitcoin's Path to New Highs?
With the potential formation of a triple bottom, key support found at $60,000, the defence of the 50DMA, and the historical bullish trends in October and Q4, bitcoin could be setting up for a breakout.
However, traders should remain cautious and monitor key levels closely, past performance is not a guarantee of future gains and traders should remain aware of external factors, such as escalations of tensions in the middle east which could put undue pressure on the market.


👉 If you're eager to connect with like-minded individuals and propel your crypto success to new heights, then CSE Plus+ is the community you've been searching for.
🏎️ In the fast-paced world of cryptocurrencies, networking with fellow enthusiasts and experts can be the key to unlocking valuable insights, innovative strategies, and profitable opportunities.
👥 Our exclusive Discord channel is where passionate crypto aficionados converge, sharing their knowledge, experiences, and market analyses.
🤝 Together, we're shaping the future of crypto, and by joining CSE Plus+, you'll be at the forefront of this exciting journey towards financial empowerment and crypto excellence.
🚨 FREE TRIAL : CSE Community Plus (monthly)
🔓 Unlock exclusive access with code UPTOBER
🤝 This is your chance to join for FREE (Saving *£100)
🫵 Don’t miss out on this one-time offer!
Seeking impartial news? Meet 1440.
Every day, 3.5 million readers turn to 1440 for their factual news. We sift through 100+ sources to bring you a complete summary of politics, global events, business, and culture, all in a brief 5-minute email. Enjoy an impartial news experience.
This Newsletter is strictly for informational purposes only; the content is generic and has not been tailored in any way. Crypto Saving Expert UAB (“CSE”) is not providing, and should not be interpreted as providing, any form of offer of any currency, security, financial instrument or digital asset, or investment advice, recommendations or strategy. The content of this Newsletter is not intended to replace your own research with regard to any assets, products or services, and any action taken on the basis of this material is entirely at your own risk. CSE neither accepts nor assumes any liability or responsibility for any loss or damage arising out of, or in any way connected to, the Newsletter content. Cryptocurrencies and digital assets may be unregulated in your jurisdiction, any profits may be subject to tax and the value of any investment could fall.
If you click on a link within this Newsletter to go through to a provider, we may get paid. This usually only happens if you get a product/use a service from it. This is what helps fund CSE and keeps the majority of our content free to use. Two crucial things you should know about this, however: a) this never impacts our editorial recommendations, if something is included, it is because we independently rate it as the best; and b) you will always get as good a deal, or better, than if you went direct. For full details on how CSE is funded, please click here.
CSE collects, processes and stores certain data. Such data may be shared with CSE’s wholly owned subsidiary company, Crypto Saving Expert Limited. Please note that by submitting information about yourself to CSE you are consenting to such use. For full details on our collection, processing and storage of data, together with your rights in relation thereto, please consult our Privacy Statement here.